logo fqa gpt

banner fqa app
Tải APP FQA Hỏi & đáp bài tập
Tải ngay
writing ielts task 1
Trả lời câu hỏi của Ánh Dương Nguyễn
right
Viết câu trả lời

Làm sao để có câu trả lời hay nhất?

  • Luôn có GIẢI THÍCH các bước giải
  • Không copy câu trả lời của Timi
  • Không sao chép trên mạng
  • Không spam câu trả lời để nhận điểm
  • Spam sẽ bị khóa tài khoản
CÂU TRẢ LỜI
Timi

26/02/2024

Trợ lý học tập AI - Câu trả lời này chỉ mang tính tham khảo
Để viết bài tả sơ đồ IELTS Task 1, bạn cần chú ý các phần sau: 1. **Mô tả sơ đồ**: Bắt đầu bằng cách mô tả tổng quan về sơ đồ, ví dụ: "The graph illustrates the average number of UK commuters using cars, buses, and trains from 1970 to a projected figure for 2030." 2. **Tổng quan về dữ liệu**: Đưa ra thông tin chính từ sơ đồ như xu hướng chung hoặc điểm nổi bật nhất. 3. **So sánh và tương quan**: So sánh các số liệu giữa các phương tiện giao thông và thời gian. 4. **Kết luận**: Tóm tắt lại thông tin chính từ sơ đồ. Dưới đây là một ví dụ về cách viết bài tả sơ đồ cho Task 1 của bạn: "The line graph provides an overview of the average daily number of UK commuters using cars, buses, and trains over a period from 1970 to a projected year of 2030. In 1970, car users were the highest at around 12 million commuters per day, followed by bus users at approximately 5 million and train users at about 3 million. Over the next two decades, there was a steady increase in the number of car commuters reaching nearly 18 million by the year 1990. Meanwhile, bus users remained relatively stable around the same level as in 1970 while train users experienced a slight decline. From 1990 onwards, there was a significant surge in car usage with numbers peaking at over 20 million daily commuters by the year 2010. In contrast, bus usage saw a gradual decline over the same period to below its initial figure in 1970. Train usage also increased steadily but remained significantly lower than both cars and buses throughout the years. Looking ahead to the projected data for 2030, it is expected that car usage will continue to rise to approximately 22 million daily commuters while bus and train usage are forecasted to remain relatively stable compared to previous years." Hy vọng rằng ví dụ trên có thể giúp bạn hiểu cách viết bài tả sơ đồ IELTS Task 1 cho biểu đồ đã được cung cấp.
Yoyooo

26/02/2024

Câu trả lời uy tín

Ngoài ra bạn có thể tham khảo bài này nữa ạ 

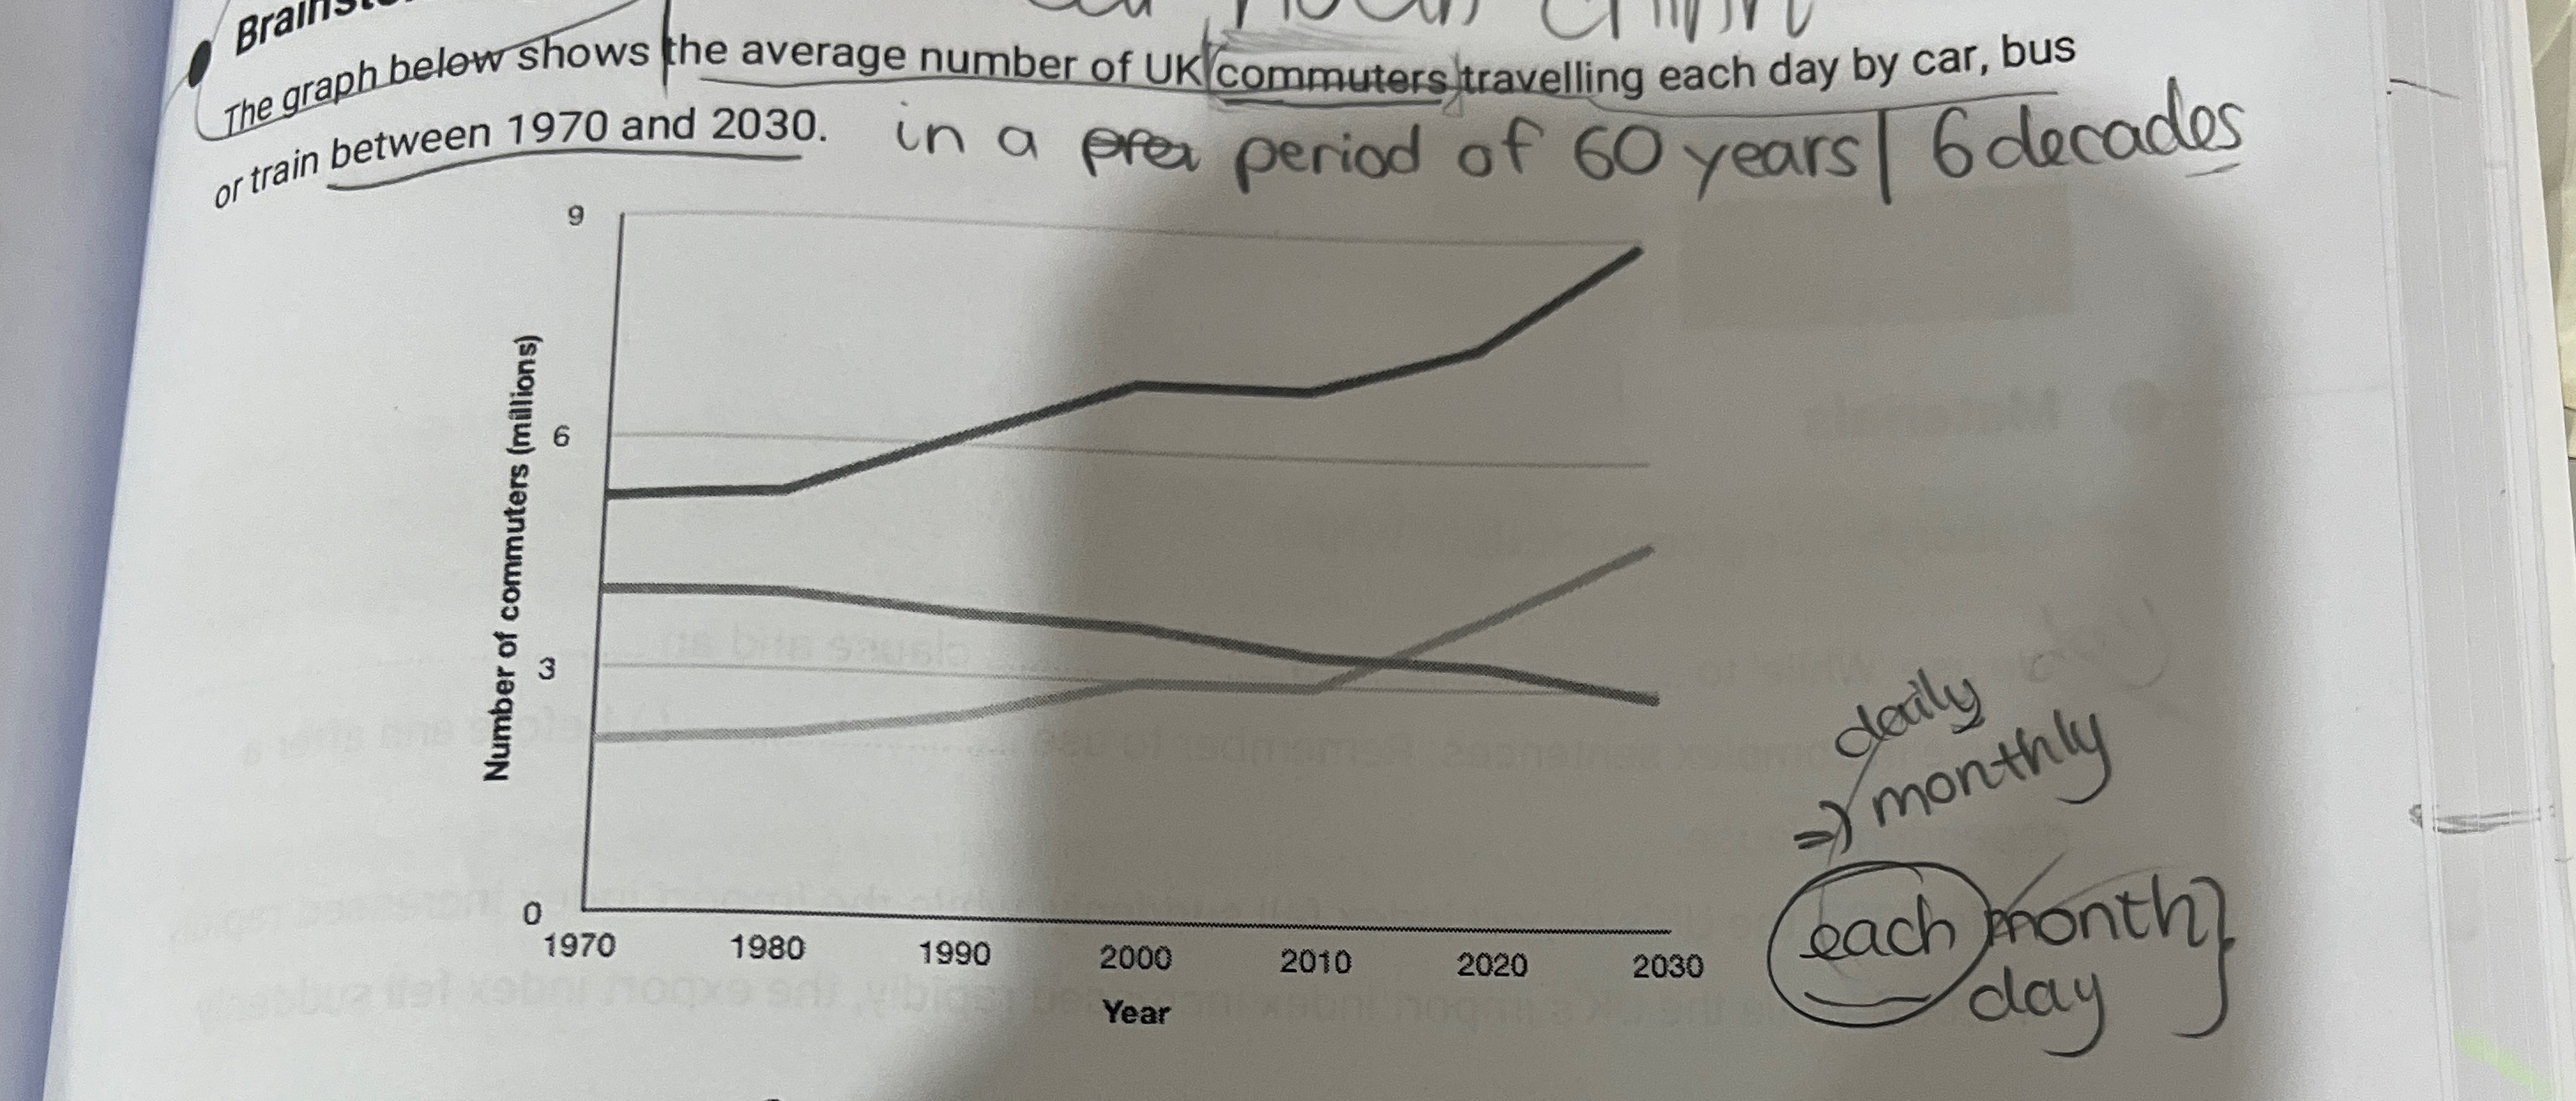
The line graph compares figures for daily travel by workers in the UK using three different forms of transport over a period of 60 years. 

It is clear that the car is by far the most popular means of transport for UK commuters throughout the period shown. Also, while the numbers of people who use the car and train increase gradually, the number of bus users falls steadily. 

In 1970, around 5 million UK commuters travelled by car on a daily basis, while the bus and train were used by about 4 million and 2 million people respectively. In the year 2000, the number of those driving to work rose to 7 million and the number of commuting rail passengers reached 3 million. However, there was a small drop of approximately 0.5 million in the number of bus users. 

By 2030, the number of people who commute by car is expected to reach almost 9 million, and the number of train users is also predicted to rise, to nearly 5 million. By contrast, buses are predicted to become a less popular choice, with only 3 million daily users.

Nếu bạn muốn hỏi bài tập

Các câu hỏi của bạn luôn được giải đáp dưới 10 phút

right Đặt câu hỏi ngay

Đăng nhập hoặc Tạo tài khoản miễn phí!

Điện thoại: 1900636019 Email: info@fqa.vn

LIÊN KẾT

FQA.vn Nền tảng kết nối cộng đồng hỗ trợ giải bài tập học sinh trong khối K12. Sản phẩm được phát triển bởi CÔNG TY TNHH CÔNG NGHỆ GIA ĐÌNH (FTECH CO., LTD)

Copyright © 2025 fqa.vn All Rights Reserved