


16/03/2024


Làm sao để có câu trả lời hay nhất?
- Luôn có GIẢI THÍCH các bước giải
- Không copy câu trả lời của Timi
- Không sao chép trên mạng
- Không spam câu trả lời để nhận điểm
- Spam sẽ bị khóa tài khoản

16/03/2024

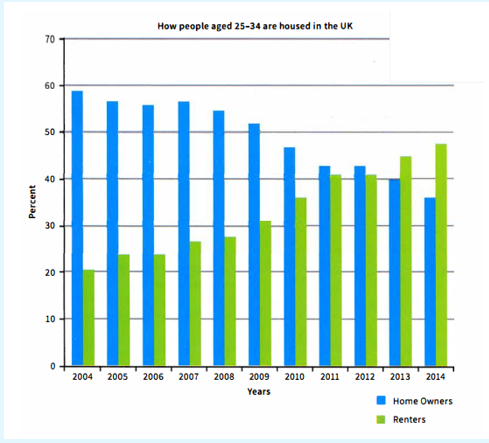
The bar chart shows how many people aged 25-34 either rent or have bought a house in the UK. Furthermore, it illustrates this change over an eleven-year period.
Overall, it can be seen from the chart that there were two different trends of the groups: upward in tenants and downward in home owners.
As regard with those people owning a house, there was a significant drop in the number of people buying houses throughout 11 years. In 2004, the percentage of home owners was nearly 60%. However, the figure fell slightly to about 55% in the next two years and then rose minimally to just over 55%. From 2007, the rate declined gradually to just under 50% in 2011 and remained stable in 2012 before stabilizing at the lowest point in 2014, just under 40%.
The rental market, however, increased substantially during the period of 11 years. In 2004, the rate of renters stood at 20% before climbing slightly to just over 20% in 2005 and stayed static in 2006. Between 2007 and 2011, renters witnessed a huge rise by almost 15%. After two years with the same proportions, the rate went up sharply again until it reached a peak at virtually 50% in 2014


16/03/2024

Đăng nhập hoặc Tạo tài khoản miễn phí!


 Điện thoại: 1900636019
 Email: info@fqa.vn


LIÊN KẾT
- Hỏi đáp bài tập
- Giải bài tập SGK
- Cẩm nang
- Đề ôn luyện
- Điều khoản & chính sách
- Sitemap
- Liên hệ
- Đánh giá và góp ý
FQA.vn Nền tảng kết nối cộng đồng hỗ trợ giải bài tập học sinh trong khối K12. Sản phẩm được phát triển bởi CÔNG TY TNHH CÔNG NGHỆ GIA ĐÌNH (FTECH CO., LTD)
Copyright © 2025 fqa.vn All Rights Reserved