Tất cả
Hỏi bài tập
Tất cả
Hỏi bài tập  Toán Học
 Vật Lý
 Hóa Học
 Tiếng Anh
 Ngữ Văn
Hỏi đời sống
Ngữ Văn
Hỏi đời sống  Tâm lý cảm xúc
 Tình cảm
 Gia đình bạn bè
 Cơ thể & Dậy thì
 Giải trí
 Mạng xã hội
 Định hướng cuộc sống
 Hỏi đáp ẩn danh

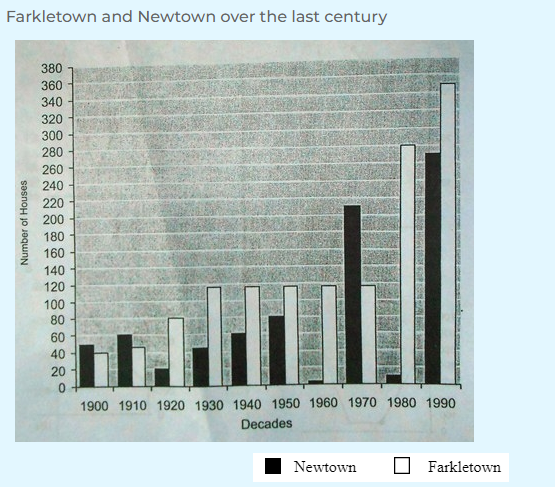
The bar chart below shows the the number of houses built per decade in two neighbouring towns, Farkletown and Newtown, during the last century. Look at the chart and then study the text which follows....

 0
0
-
Câu trả lời phải chính xác, đầy đủ dựa trên kiến thức xác thực:
- ✔ Đối với câu hỏi trắc nghiệm: Đưa đáp án lựa chọn + giải thích lý do chọn đáp án.
- ✔ Đối với câu hỏi tự luận: Đưa lời giải và đáp án cho câu hỏi.
- ✔ Đối với câu hỏi trả lời ngắn: Đưa ra đáp án + giải thích lý do.
- ✔ Chấp nhận sử dụng ảnh do thành viên viết tay, ảnh cần rõ nét, không bị mờ, vỡ ảnh.
- Sử dụng ngôn ngữ rõ ràng, dễ hiểu.
- Tránh đưa ra các ý kiến cá nhân mang tính chất chủ quan.
- Nếu sử dụng thông tin từ nguồn khác, phải trích dẫn nguồn đầy đủ và chính xác.
- Tuyệt đối không được sao chép các thông tin từ các trang khác, từ AI hoặc chatGPT.


02/04/2024
 0
0 02/04/2024
The number of houses built per decade in the towns of Farkletown and Newtown over the last century
The bar chart shows the number of houses built per decade in two villages, Farkletown and Newtown, in the last century.
Overall, the number of houses that were erected in Farkletown exceeded the quantity constructed in Newtown. Additionally, while the former witnessed a steady rise in the number of newly built houses, the latter experienced a wild fluctuation over the given period.
It can been seen from the chart that Farkletown saw a steady rise from (P) 60s in the first (R) two decades of the century, to just under 120 during the Thirties. (N) 1920s , new house construction in Farkletown remained constant at just under (M) 120. This is in sharp contrast to (D) the last two decades of the century when the number of houses in Farkletown leapt, first to (F) 280 and then to (A) 350 .
House building in Newtown, by comparison, was much more (I) erratic . In the (N) 1920s of the century, more houses were erected in Newtown than in Farkletown. During the (G) 70s , however, construction declined to (B) only 20 . Over the next (H) three decades , house numbers rose steadily, only to drop (L) practically to zero in the (J) 80s . There was then a dramatic surge in the (Q) 10 years with (K) over 200 houses being built. While (S) a rise of more than 2600% saw house building in Newtown plummeting to(C )40 ,inthe90sthenumberofnewhousesrocketedto270,(E )overthenext40years onthepreviousdecade.<img src="https://minio.ftech.ai/fqa/social/question/76c7a9f4-cbc3-4165-b67a-d99fc5167a2f.png">
0 Nếu bạn muốn hỏi bài tập
Các câu hỏi của bạn luôn được giải đáp dưới 10 phút

CÂU HỎI LIÊN QUAN
27/06/2025
Top thành viên trả lời
 Địa chỉ: Số 21 Ngõ Giếng, Phố Đông Các, Phường Ô Chợ Dừa, Quận Đống Đa, Thành phố Hà Nội, Việt Nam.